This is what you get every day
No guessing. No vibes. Every day, every sport, the same data sheet: the player, the exact line, and the hit rate that put it on the list.
These are real sheets from inside Premium, from the last week of September 2026, and how each one graded out.
NFL Template: 47 of 61 hit across September. 14 missed. All 61 graded in public.
How to read a sheet in ten seconds
That third column is the whole point. A prop doesn't make the sheet because somebody "has a feeling." It makes the sheet because the numbers say it has been clearing that line.
Don't take our word for it. Check the numbers.
Every night, a results post goes up in the CHEESELOCKS Discord with every sheet graded: how many legs hit, out of how many. We went back and added up every one of them we could find, from June 2 to September 30, 2026.
Source: the daily "Template Results" posts in the CHEESELOCKS Discord, June 2 to Sept. 30, 2026. Days without a results post aren't counted. Past results don't guarantee future results.
Not one hot week. Four straight months.
Anybody can screenshot one good day. Here's every month, side by side.
| Month | Legs hit | Hit rate | Days at 70%+ |
|---|---|---|---|
| June | 420/550 | 76.4% | 22 of 27 |
| July | 383/477 | 80.3% | 22 of 27 |
| August | 474/600 | 79.0% | 25 of 30 |
| September | 379/482 | 78.6% | 23 of 28 |
Every month landed between 76% and 81%. No spikes, no cliffs. Just the same process, run the same way, every single day.
Every day since June 2
Each square is one day of graded sheets. Tap or hover any day to see the exact count.
June
July
August
September
92 of 112 days finished at 70% or better. The longest run was 12 days in a row. And yes, the gold and red days are on there too.
Sport by sport
| Sheet | Legs hit | Hit rate |
|---|---|---|
| MLB | 876/1,083 | 80.9% |
| WNBA | 508/633 | 80.3% |
| NFL (since Sept. 13) | 41/52 | 78.8% |
| Other sports (NBA, NHL, UFC, boxing) | 91/127 | 71.7% |
| Demon templates (the long shots) | 140/214 | 65.4% |
The Demon templates are the long shots, and they hit less. We count them anyway, because a record that leaves out the hard ones isn't a record.
September's monthly results post on Whop includes a couple of graded days we couldn't find a daily post for, so its totals run slightly higher (NFL 47 of 61, MLB 222 of 270).
The bad days, too
These are the five worst days in the whole stretch. We're showing you these on purpose.
- July 232 of 540%
- July 144 of 850%
- June 226 of 1155%
- August 1312 of 2060%
- August 812 of 1963%
Only 1 day out of 112 finished under 50%. Bad days happen. What matters is that you can see them, and they're still posted.
What a hit rate means, and what it doesn't
78.5% is the share of individual legs that hit. It is not a promise about any slip, any day, or any amount of money.
Stack legs together and the math changes fast. If every leg hit 78.5% of the time on its own, here's how often all of them would hit together:
That's why we give you the data and the full record, and you decide what to play and how much. Keep it small, keep it smart, and never chase.
Why you need the data early
Lines move during the day. Say a pitcher's strikeout line is 5.5 when the sheet goes out. By first pitch, it's 6.5. Same pitcher, same game, just harder to hit.
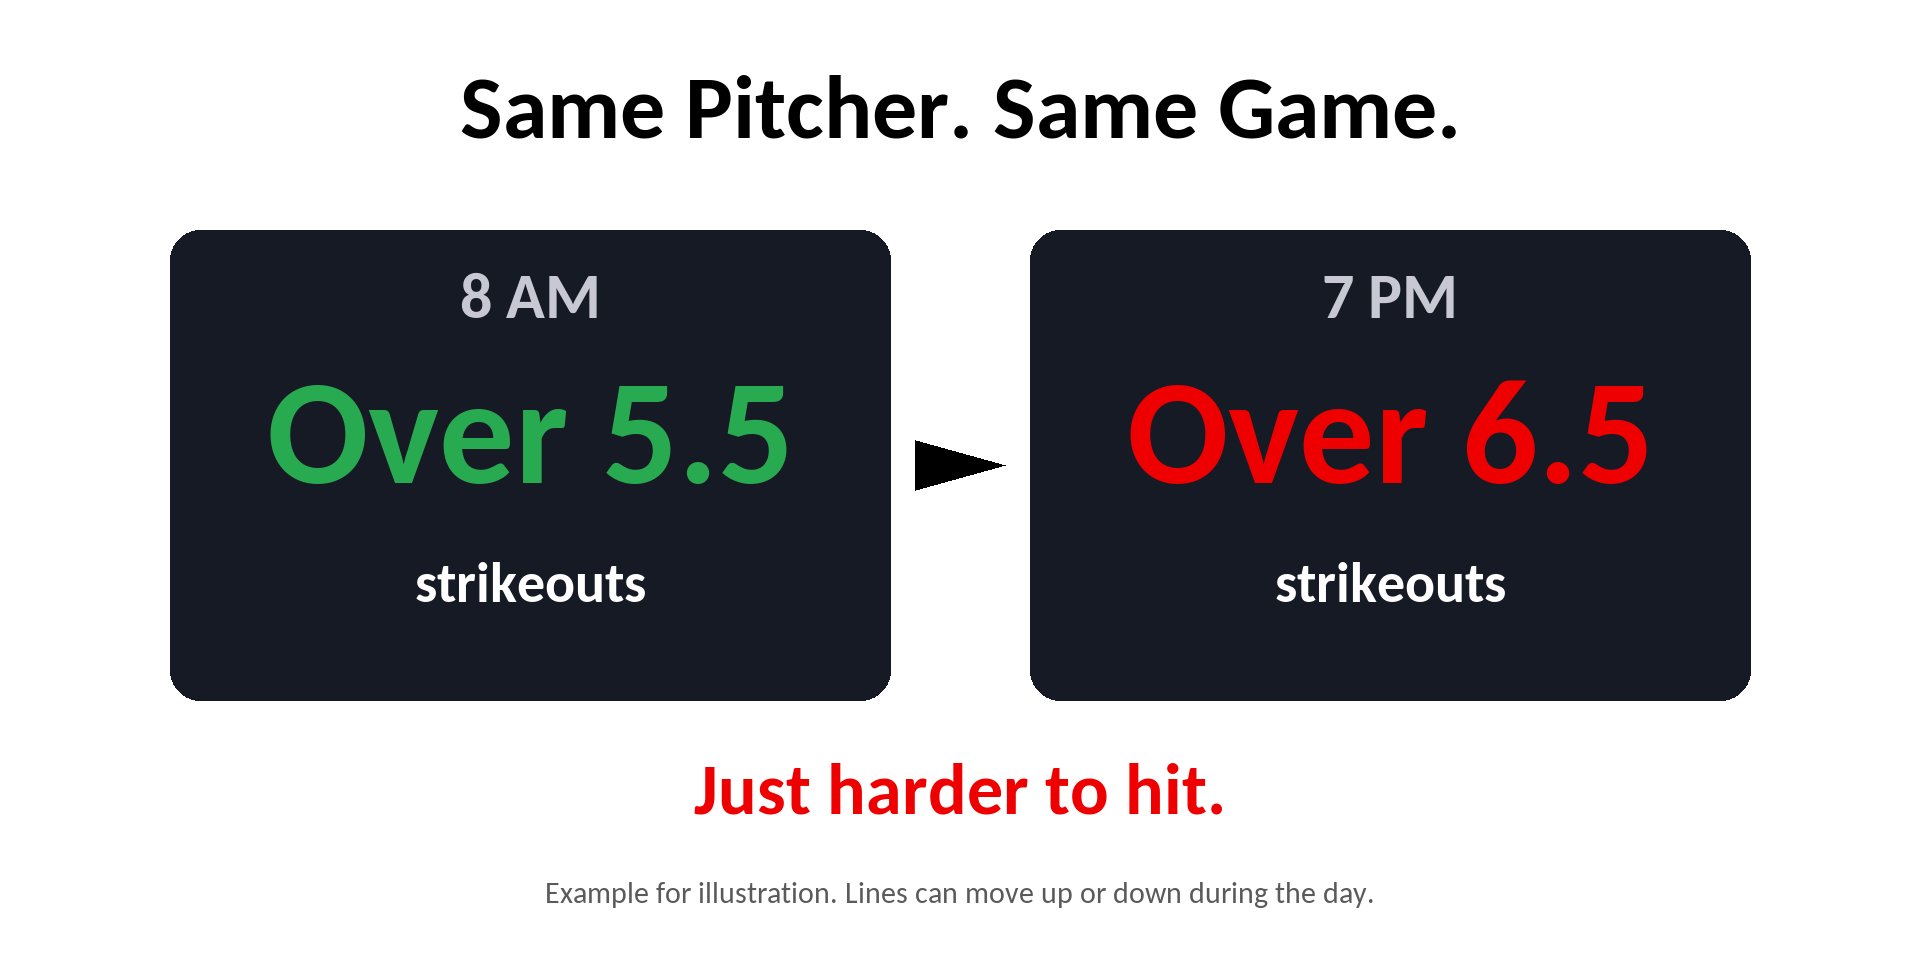
The data is only an edge if you have it before everyone else.
That's why the sheets go out hours before game time, not five minutes before the game starts.
Most people play without the data
They play the way the apps want them to:
- Playing at 7 PM, after the line already moved
- Tailing a caption with no numbers behind it
- Chasing yesterday's losses
- No hit rates. No record. Nothing graded.
Sports betting is big business. Americans legally bet a record amount on sports last year:
The only question is whether you play with the data in front of you, or just feed the apps.
Who am I?

Hi, I'm Cheese. 2K YouTuber with 1.57 million subscribers, turned founder of CHEESELOCKS.
Over 31,000 people have joined, and they rate it 4.7 stars on Whop.
Like a lot of y'all, I play the games I watch. My whole family told me to stop. So I did it different. I stopped playing off vibes and started running every game through the data. That's where the sheets came from.
What members say about the data
"Shout out to the template"
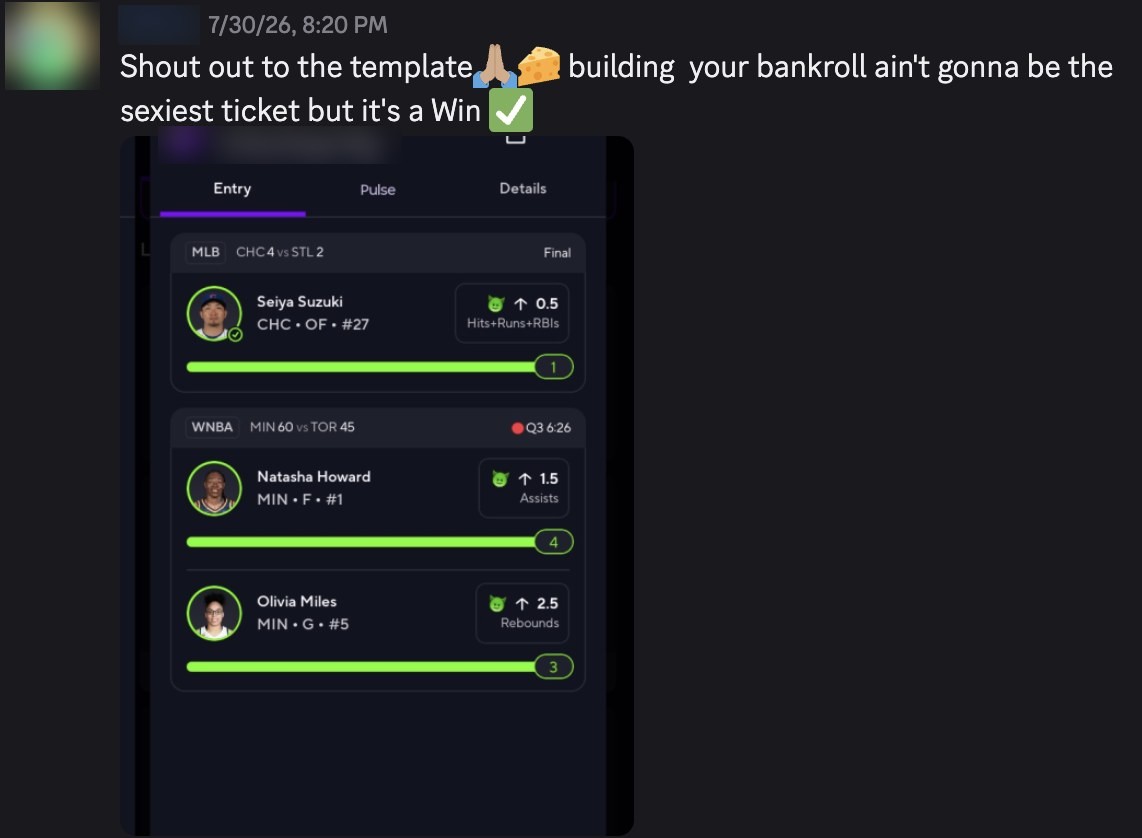
Shout out to the template... building your bankroll ain't gonna be the sexiest ticket but it's a WinMember post in the CHEESELOCKS Discord, July 30, 2026
From June through September, members shared 608 screenshots in the Discord's member wins channel. A wins channel only shows the wins, though. For the full picture, go by the graded numbers above.
Last week, straight from the recaps
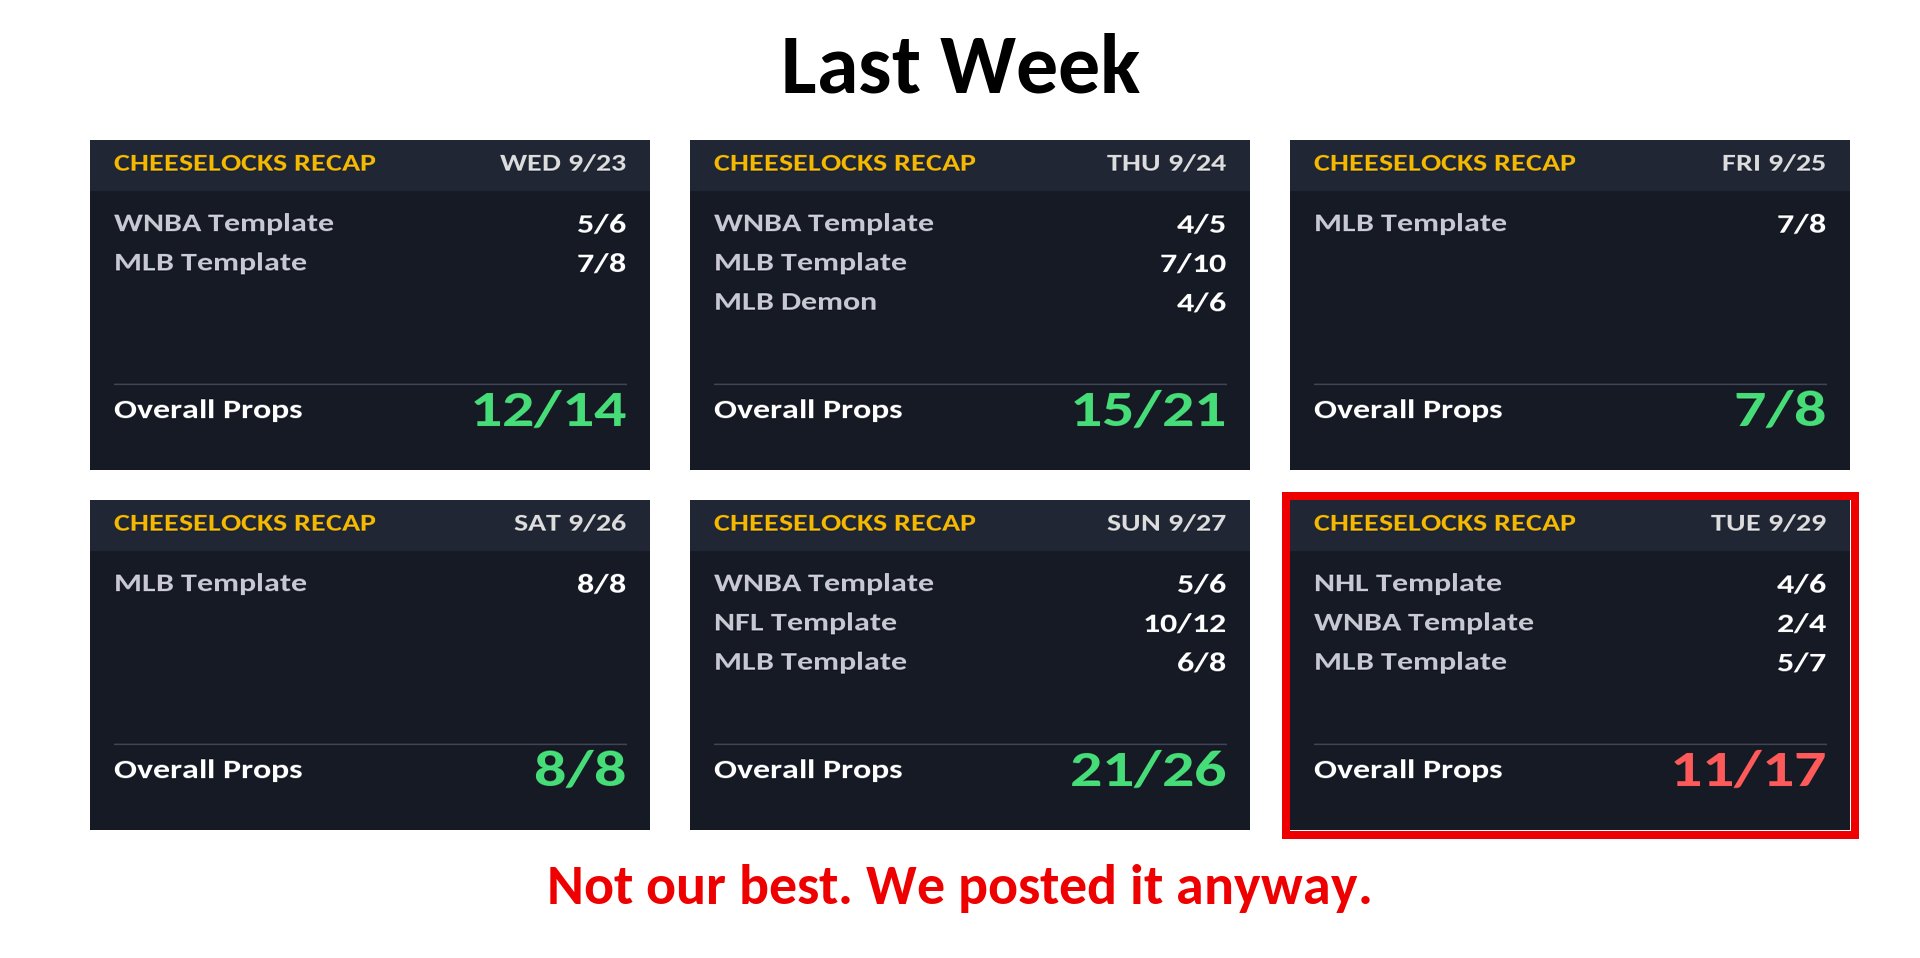
Because data you can't check isn't data. It's a sales pitch.
Here's what you get inside Premium
- The daily data sheets. Every sport we cover, the player, the line, and the hit rate.
- Early access. Sheets go out hours before game time, before the lines move.
- The graded recap. Every leg, every day. The good days and the bad ones.
- The Discord. Going all day.
Open the sheet. Choose your plays. Close it. Five minutes.
If all this did was...
- Put real hit-rate data in front of you, would it be worth it?
- Get you in before the lines move, would it be worth it?
- Show you every loss, so you always know where you stand, would it be worth it?